 (VA511), VPRS 5707/P0000, Rate Books (Hotham/North Melbourne), 1855.")
Last updated:
‘The value of rate books and multi-scale analysis: a Hotham/North Melbourne case study’, Provenance: The Journal of Public Record Office Victoria, issue no. 21, 2023-24. ISSN 1832-2522. Copyright © Fiona Gatt.
This is a peer reviewed article.
Imagine there was a document from nineteenth-century Victoria that could tell you where a person lived and what their house was like, whether they owned it or rented, how big it was, what it was made of and what their occupation was? And what if that document could also tell you all that information about all of their neighbours? And the whole local government area? What if that same archive could tell you what percentage of people in an area rented their properties in one year, and how that changed over the course of a decade, and several decades, including a breakdown of ownership by occupational status? Such an archive does exist: the rate books held by Public Record Office Victoria. This paper explains what rate books are and how they offer multi-scale analysis—the ability to zoom in and out at micro and macro levels. The use of rate books by professional historians to quantify data as evidence of the material development of a local area has received little attention for several decades. This method of analysis can and should be revived. Using samples of evidence from a study of the nineteenth-century rate books for Hotham/North Melbourne, this paper reveals the remarkable details about the development of housing ownership patterns these archives can provide.
Introduction
During the morning tea break at a recent history conference, I met a retired, yet very active, academic historian with a long track record of publications in Australian local/labour history. When I explained my PhD research project—a local/urban history of Hotham/North Melbourne in the nineteenth century, adding that rate books were one of my main archives—his response was: ‘How old fashioned!’ His comment was not meant as a criticism; he was delighted, as was I.
The popularity of quantifying rate books in academic work has waned over recent decades and yet there is so much they have to reveal about nineteenth-century Melbourne (and, indeed, colonial Victoria). They remain a familiar repository for family historians, answering questions such as where did my ancestor live and when, and what does the size, value and location of their dwelling, and their occupation, tell me about their lifestyle? Professional historians use rate books to ask similar questions about their subjects. However, when it comes to the collection and analysis of large amounts of data from the rate books, a surprisingly short list of academic studies has accumulated.
In this article I provide a sample analysis focusing on the nineteenth-century development of Hotham/North Melbourne. In doing so, I draw attention to how rate books can provide both a micro and macro lens for analysis, providing insight into the street and household level, the unique characteristics of a locality set within a case study, and the particularities of a decade exposed within the frame of long-term trends. Using the quantitative data from rate books in concert with qualitative sources provides a more complete picture of habitation patterns over time.
What are rate books?
The rate books held by Public Record Office Victoria (PROV) are a wonderfully rich source of socio-economic demography, especially expressed in housing patterns. PROV’s collection of 8,702 rate books starts in the early 1840s and includes records from boroughs, towns, shires, municipal districts, road districts and cities across the colony (later state) of Victoria. I am most familiar with the nineteenth-century archives (though PROV holds records up to 1994) and this paper aims to draw attention to their methodological value for that era.
Rate books were (and continue to be, though now in a digitised format) composed by a council employee—the rate collector. In the nineteenth century, the first step in the process was the production of the valuation book. PROV holds 1,331 valuation field books in its vault. Valuation field books often contain more information than rate books, but the paucity of surviving records means that a researcher will often find that years are missing or that no records are available for their chosen locality. In compiling the valuation fields books, the rate collector would literally walk up and down every street, noting the details of properties and determining a rateable value based on improvements to the land and building type and size (though, given the weight of the ledgers, I assume the work was done on a notepad and then transferred). Some valuation books include information about the residence of landlords and the number of people who resided in a dwelling (which are not, generally, included in rate books). While many valuation books have not survived, much of the information they contained was transferred to rate books—great heavy ledgers, often leather bound (see Figure 1).
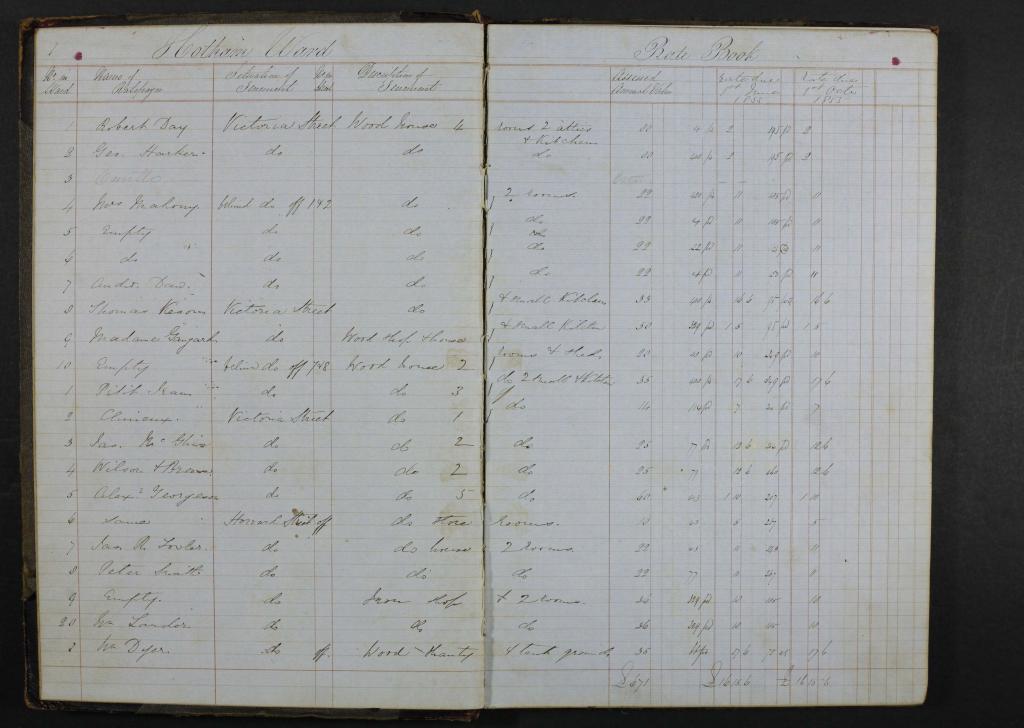
Figure 1: This 1855 rate book, the first available for Hotham/North Melbourne, does not provide occupation and ownership information or street numbers (which had not yet been assigned); however, improvements are included, such as outbuildings and whether the dwelling had a kitchen. PROV, Melbourne (Town 1842–1847; City 1847-ct) (VA511), VPRS 5707/P0, Rate Books (Hotham/North Melbourne), 1855.
The purpose of a rate book was to keep track of the annual rate due (a tax based on a percentage of the value of a property) and when it was paid, the latter being recorded in the right-hand column. The more interesting information concerned the property and the people who lived there. The quality of this information varied from year to year and decade to decade. At the very least, notations usually included the street name, name of the resident/owner, type of building (i.e., house, shop, factory, stable, etc.), building material (i.e., brick, wood, lime etc.), number of rooms and annual rate due. Yet, more often than not, rate books also included the street number, the name of a resident (if different from the owner, or the notation of ‘self’ for owner-occupiers), occupation of the resident/owner and address of the landlord/owner. All of this information can be quantified and analysed.
Literature review
There are some examples of academic studies that privilege rate books: for example, Weston Bate, in his A history of Brighton (1962), used statistical data from government records, newspapers, church records and extensive rate book analysis.[1] Nevertheless, there are few sets of data on nineteenth-century Melbourne housing, possibly due to the time-consuming process of data collection such research requires. Exceptions include Graeme Davison’s PhD thesis (1969), the precursor to his well-known monograph, The rise and fall of marvellous Melbourne (1978), which provides some Melbourne data for 1888–95;[2] John Lack’s A history of Footscray (1991), which enhanced our knowledge of tenants, landlords and homeowners;[3] and Terry Grigg’s 1994 PhD thesis, which analysed tenant and landlord relations from 1889 to 1891 for one ward of Collingwood.[4] Each of these studies used rate book analysis alongside qualitative research. Dingle and Merrett’s work in the 1970s on homeowners, tenants and landlords took a quantitative, demographic focus and is limited to six case study areas of Melbourne in the period 1891–1911.[5] Several notable contributions use rate book data to analyse housing patterns outside of Melbourne.[6]
Bate’s mixed-methods approach is renowned for having inspired local and urban historians in Victoria for decades; however, only those studies mentioned here have made significant contributions to rate book data for Melbourne.[7] The relative decline of urban history as a discipline and the move to ‘transcend urban and national boundaries’, as James Lesh put it, has drawn attention away from local studies in which rate books are most useful.[8] They have been at the forefront of heritage reviews, including for North Melbourne; however, such studies tend not to offer long-term analysis.[9] In general, studies that include long-term big data have been limited to unpublished theses.[10] In relation to Melbourne, what these show are the peculiarities of localised patterns of development, ownership and occupation across the metropolis. With so many areas not yet analysed, let alone subject to any comparative long-term analysis, there is so much more that rate books can reveal.
Multi-scale analysis
To explore and explain the great wealth of information that rate books provide, I will take you on an archival research journey, starting with the individual, then moving to the street, to the broader place, and, finally, to the findings of my long-term analysis, which reveals material and class development over time. I draw my examples from my research, which has made me intimately familiar with the rate books for the municipality of a particular inner area of Melbourne: Hotham/North Melbourne.[11] Having discouraged First Nations people from residing in the Melbourne area, the Crown sold land dubbed as ‘North Melbourne’ in the frenzy of the gold rush in 1852. The Municipality of Hotham was established in 1859, changed its name to North Melbourne in 1887 and then rejoined the City of Melbourne in 1905 (in the process dissolving North Melbourne Council). We know the area today as the suburb of North Melbourne (see Figure 2).
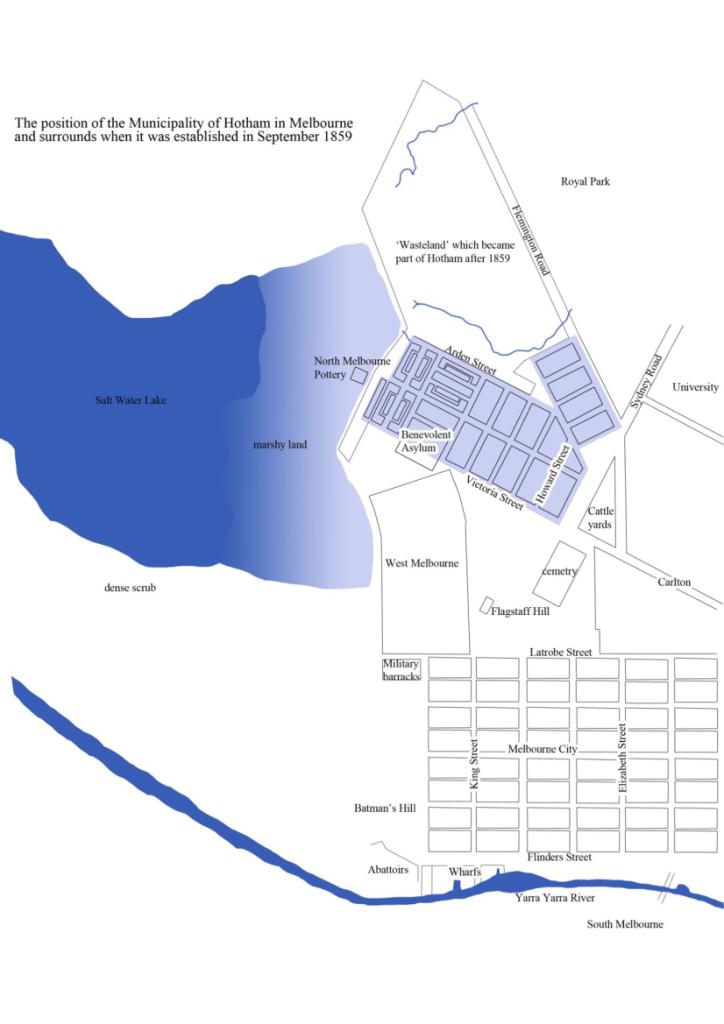
Figure 2: The area developed by the time the Municipality of Hotham was created in 1859 is highlighted. The border of the entire municipality then runs from Flemington Road to the north and next to the swamp. Map drawn by author.[12]
We start in terrain that is familiar to family historians, who use rate books to track the residence and occupation of individuals and families. The information provides a strong indication of an individual or family’s place in the socio-economic fabric of society. This work can be rather onerous. The process of finding someone listed in the directory (Sands & McDougall for nineteenth-century Victoria) is often more user-friendly. Once you have found them there (or know from another source where they may have lived), establish what municipal area that location was part of at the time, choose a relevant year and locate them in a rate book. The rate books are organised at PROV by local government area.
In this example, we find Thomas Avis, who moved from Carlton to Hotham to set up a cabinet-making business on Errol Street in the 1860s, which is easily located in the Sands & McDougall Directory.[13] To search for his residence in Hotham, I began with the rate book for 1871, which is available to view online.[14] PROV provides digitised, scanned images of every page of rate books for Hotham/North Melbourne (and many other localities). Handwritten documents are not searchable, and you will be lucky if you find an index at the beginning listing the page numbers for each street. If you know the street where an individual lived, you can scroll through the pages until you find the information for that street, and then find their name. Thomas Avis is listed in the 1871 rate book as landlord to six, three-roomed brick dwellings in Chapman Street, Hotham (see Figure 3).
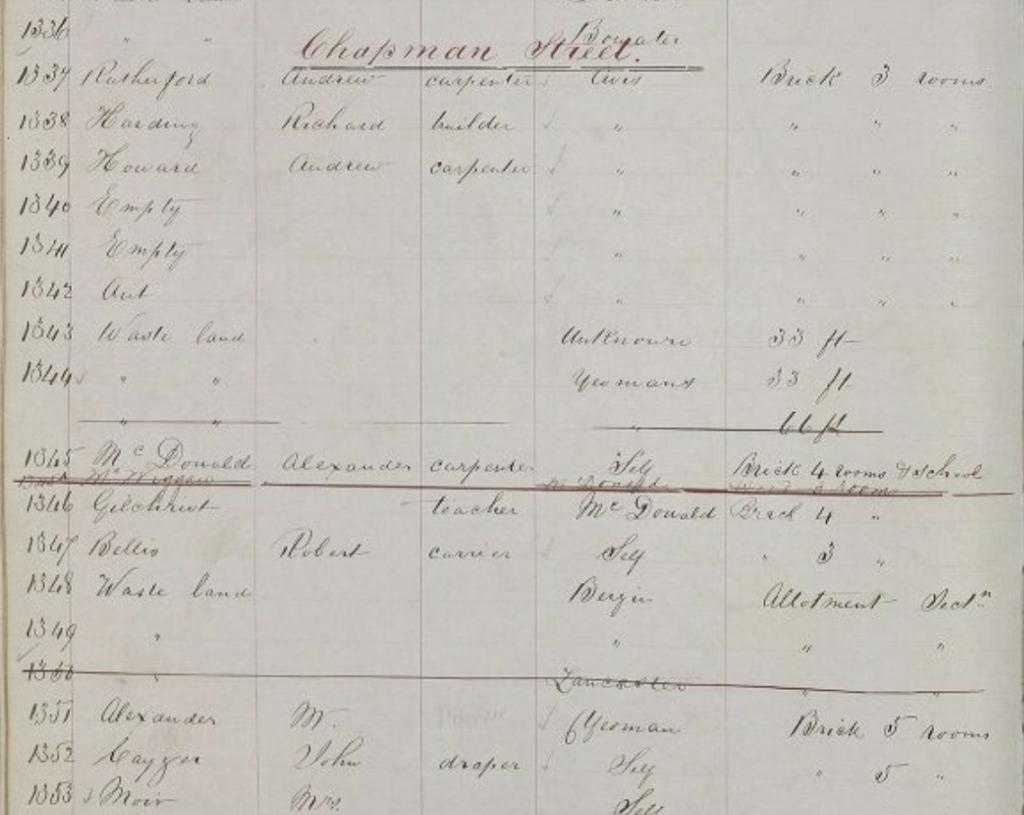
Figure 3: A zoomed-in portion of part of the information for Chapman Street in 1871, PROV, North Melbourne (Borough of Hotham 1859–1874; Town of Hotham 1874–1887; Town of North Melbourne 1887-1905) (VA3153 ), VPRS 5707/P0, Rate Books (Hotham/North Melbourne), 1871–1872.
How the information is organised varies somewhat in rate books. It is wonderful when you find the whole side of one street listed in order; this is how side streets are presented. On long main roads and streets, the list of properties is often broken into sections, as the compiler of the information would take a detour into a side street and re-emerge onto the main road or street. If you don’t know the street but the municipality only, you must visually scan down the list of names until you find them. The alternative is to order the hard copy original of the rate book for viewing in the PROV reading room.
Using the hard copy in the reading room can be particularly useful for the second stage: once you have found the household you are looking for in one rate book you can then track them backwards and forwards in time. If they owned their own home and stayed there for many years this can be relatively easy. However, renter households and shopkeepers often moved every few years. Relocating them can be a time-consuming but profitable exercise, as their relocation often coalesced with other life circumstances such as a growing family, the death of a breadwinner, children coming of age to contribute to the family income, an increase or decrease in business success, and other factors.
After locating an individual (or family), you can begin to understand their position within the socio-economic fabric of society by paying attention to the context of the street in which they lived. This is also the beginning of our journey into the terrain of urban, local and social history. This stage requires complimenting the rate book information with other archives to help identify other residents and explain and contextualise the residential development. In this example, I have used Crown land sales, newspapers and council records.
The north side of Chapman Street, where Avis’s properties were located, was sold in January and September 1864 (and the southern side a year later in September 1865).[15] Almost all the allotments on Chapman Street were sold to Hotham residents and most of them were not subdivided but instead retained their original frontage of 66 feet (20 metres). The 1871 rate book shows that the north side of Chapman Street had 15 households interspersed between undeveloped land. Six of these properties were rented and nine were owner-occupied. Alexander McDonald, a carpenter, lived in his four-roomed brick house, and the property also featured a private schoolhouse run by Ann McDonald. The McDonalds were landlord to their neighbour, the future head teacher at Hotham State School No. 459, Daniel Gilchrest.[16] Robert Bellis, a carrier, lived next to Gilchrest. Three large empty allotments followed before reaching the substantial brick house owned and rented out by Mr Yeomans, who also owned one of the undeveloped blocks passed earlier. It stood next door to another two, five-roomed brick houses occupied by their owners, John Cayzer, draper, and Mrs Moir. The artist David Drape and gentleman Henry Southy followed. Next door were two even larger houses, each featuring six rooms, one owned and occupied by John Barwise, already thrice the mayor of Hotham, and John Young, a successful cooper.[17] At the end of the street, Thomas Johnson, who ran a carting business, lived in a large wooden house, the only wooden house on the street, surrounded by his undeveloped land.
By looking at the level of the street we begin to get a sense that Thomas Avis’s ownership of six, tenanted, three-roomed dwellings was unique in the overall context of this street, where larger, owner-occupied properties surrounded by substantial blocks of undeveloped land was the norm. Yet, at the same time, Avis was not unique as a local business owner investing in property. Drawing our lens out further to develop a small case study reveals further complexity to the locality. In this case study, I compare the north side of Chapman Street just described—the ‘hill’—with a nearby area of similar size I will refer to as the ‘triangle’ (Figure 4). By drawing on other qualitative archives, such as newspapers, memoirs and charity organisation records, we start to understand that the realities of living in Hotham were informed by class distinctions sentimentally ascribed to, and materialised in, the urban environment.
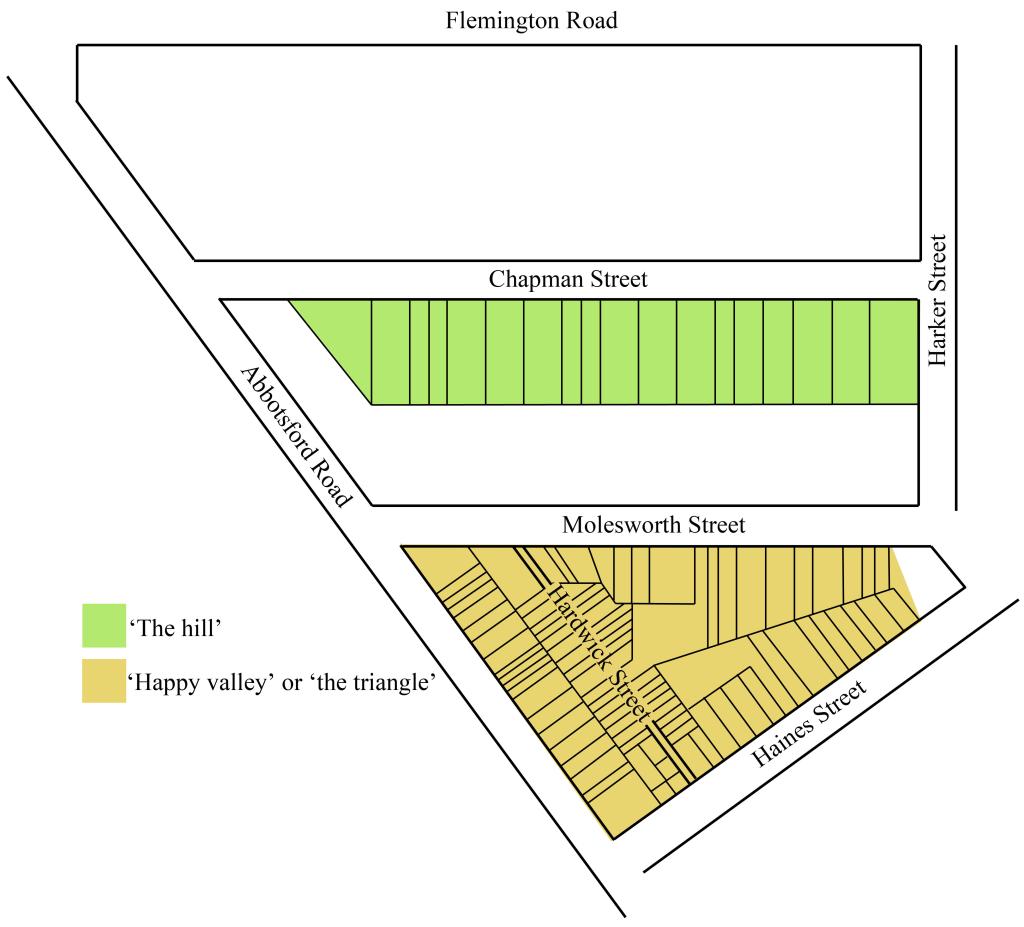
Figure 4: The ‘triangle’ and the ‘hill’ case study areas. The size of the blocks pictured are to be considered a visual guide to the pattern of development, not an accurate plan to scale. Map drawn by author.[18]
The hill, the north side of Chapman Street (where Avis lived), was part of an area dubbed ‘Hotham Hill’. Hotham Hill was not an official name; rather, it was a moniker used by residents for a specific section of the borough, and, more obviously still, in advertising to describe areas of Hotham associated with genteel, larger blocks and detached homes.[19] For this reason, Hotham Hill did not denote a subsection or even a series of adjoining streets. Chapman Street—with its hillside land, large blocks and views of the bay—was considered part of Hotham Hill and referred to as such in newspapers.[20] Erskine and Brougham streets, which were also in a more elevated position than surrounding streets, similarly earned the name. Yet properties in Dryburgh Street, in the older area of town, were also considered part of Hotham Hill.[21] This was, in part, a direct consequence of the topography of the land and the advantages of a view from an elevated position. Hotham Hill was clearly associated with privileged benefits, suitable ‘for a person who wishes to be in the country and yet within an easy distance of town’, explained one advertisement.[22] This social or unofficial division of the suburb provided a mental map that spoke to the class distinctions within Hotham. Other areas of Hotham that featured a predominance of semidetached cottages, terraces, rows of homes with party walls, shops and factories, were excluded from the privileged label.
Representing a similar size in land area to the north side of Chapman Street (the ‘hill’), the triangular block down the hill (the ‘triangle’) was bounded by Molesworth Street, Haines Street and Abbotsford Road, with its narrow intersection of Hardwick Street. This was typical of a part of Hotham that, in the 1870s, according to a journal entry by a Melbourne City missionary, was known as ‘Hill Side Alley’. A memoir reveals that by the early twentieth century it was known as ‘Happy Valley’.[23] This area, too, was influenced by the natural geography of the land; Haines Street had been a natural creek and the area could be subject to drainage issues.
The triangle was mainly populated by working-class residents and had a similar pattern of ownership to the hill. However, there was a marked difference in terms of physical urban development. In 1871, 58 per cent of the dwellings in the triangle were occupied by their owners.[24] This was marginally higher than the ownership rate (of the occupied properties) on the hill, which was 55 per cent. Here was an aspirational working class, whose hopes were facilitated by living in Hotham. The owners in the valley included labourers, masons, smiths, drapers, dealers, butchers, carters and carpenters; a builder, a cabinet maker, a cabman, a drayman, an engine driver, an engineer, a joiner, a miller, a saddler, a sawyer, a storeman, a toll collector and a watchman also lived there—all having chosen to take advantage of the subdivision of this newly released land to build their own homes.
What we see is a mapping of middle-class sensibilities onto the land on the hill and the working-class response to the opportunity for home ownership in the triangle. The rate books are again instrumental in what they reveal. In the triangle, more than half of the houses were made of wood—a more affordable building material than brick—and the average size was 2.6 rooms, compared to the average on the hill of 4.1 rooms. The value of these smaller properties was, of course, lower than the villas on the hill. The lowest annual rate was £5 while the highest-rated property was £30. The average annual rate of an occupied property on the hill was £35 while in the triangle it was £14. With almost five buildings in the triangle for each one on the hill, the density of development in the triangle was far greater. The yard size in the triangle was considerably less than on the hill. The properties with a higher value in the triangle were on the outer streets, while the smallest was found in Hardwick Street (see Figure 3). The more densely packed triangle also featured more than just residential housing. Although Ann McDonald ran a private school on the hill, this was the only business in the street, creating an atmosphere of private residential living. In the triangle, by contrast, the public sphere conveniently intruded into the residential space. Molesworth and Abbotsford streets both had a bakehouse and a few shops (a drapery, joinery and millinery store on Molesworth Street, and a general dealer and store on Abbotsford Street).[25] The triangle also had a hotel, the Abbotsford Hotel, licensed to Anthony Rohan.[26] This case study gives us a snapshot of the distinct zones of use, ownership and material development that had occurred in Hotham by 1871.
Zooming out further, the next level of analysis of the rate books provides us with a decade-level, long-term view. In my larger project, these quantitative data were paired with qualitative sources. While this paper focuses on extolling the virtues of rate books, both are crucial. Qualitative research in records such as newspapers, memoirs, correspondence, and local government and charity organisation archives (among others) provides insight into the felt connections and aspirations for the local area that developed over time. In Hotham/North Melbourne there was a persistent aspirational desire that home ownership should be achievable for all hard-working households. The rate books reveal the outcomes of the nineteenth-century property market.
In my research project, a sample of 1 in 10 properties, in rate books spaced 10 years apart from 1861 to 1901, was taken. The sampling of 1 in 10 properties provides a statistically significant data set and is the sampling rate used in the academic studies mentioned earlier. The spacing of the rate books 10 years apart to cover a long period ensures that changes captured over time are more evident and meaningful.
Occupations were categorised according to wage and skill levels and also according to how the type of work resulted in patterns of behaviour, status within the community and expectations of living standards: unskilled (manual labour or low paid), semiskilled (occupations requiring a specific set of skills though not advanced and usually manual), skilled (occupations that required advanced skills in making goods or performing services), traders and lesser professionals (commercial and retail traders), white-collar workers (no manual labour, requiring formal training and/or under the control of the regulatory body) and managerial/professional (large business owners, independently wealthy or professionals).
To facilitate the research in practical terms, I downloaded the digital files of the rate books from PROV and had them printed on A3 paper so that I could make notes directly on the page. I used a multicoloured highlighting system as I counted. The information was then collated into Excel. The data collected revealed patterns of tenancy rates, the occupational make-up of the heads of households and how this changed over time, and the patterns of value, building size and building material of the locality over time.
Taking the 1871 rate book as a snapshot indicative of the development of the area in the 1860s, working-class families with consistent employment had agency in choosing to invest in an affordable home to own, on par with middle-class residents, who also had agency to achieve their goal of a detached villa on a larger title.
There was, however, a sharp divide concerning home ownership within the working-class strata. It was far more likely for unskilled and semiskilled workers to rent than other occupational groups (Figure 5). The average value (of the annual rate) of both rented and owner-occupied properties in 1871 increased with the corresponding income of the occupational category of the resident (Figure 6).[27] Yet there was a great diversity in value between the lowest and the highest valued properties lived in by each occupational group (Figure 6). Family composition—the number of income earners, of children and/or elderly dependants—must have had a great impact on housing decisions and opportunities. Some labourers, and many skilled artisans, were able to achieve not only home ownership but also ownership of one, or even multiple, rental investments next door to their residence. Skilled artisans were also more likely than merchants and traders to own their own homes. This is not necessarily a reflection that shopkeepers and publicans were not as economically stable as skilled workers; it is more likely a reflection that shopkeepers and publicans chose to lease their business premises in which they also lived, because of the flexibility this afforded.
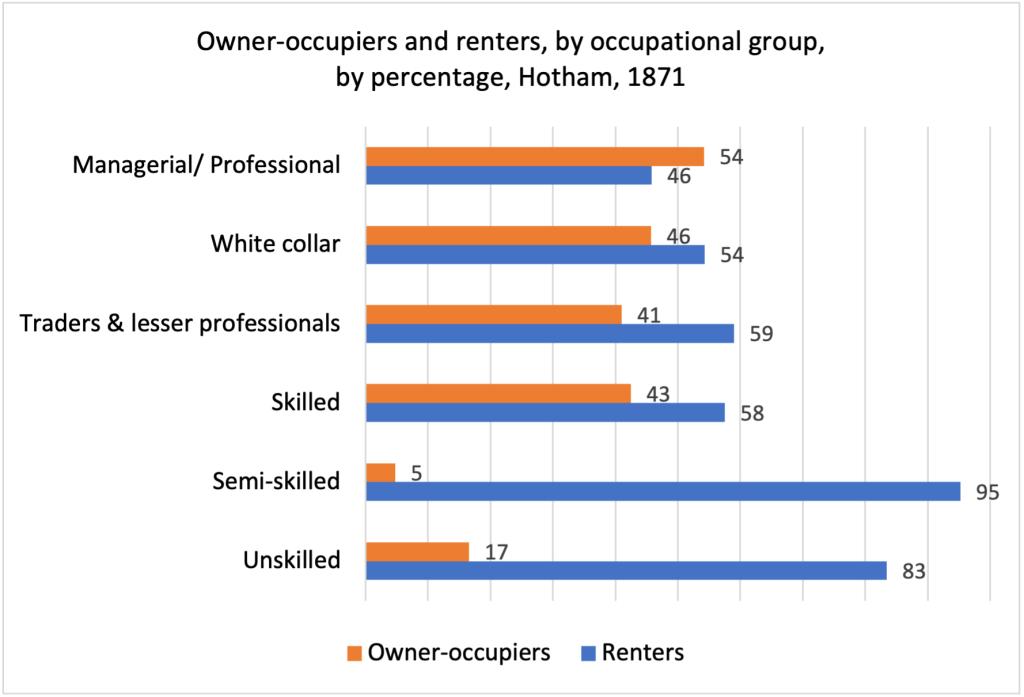
Figure 5: Owner-occupiers and renters, by occupational group, by percentage, Hotham, 1871. Calculated from a 1 in 10 sample of PROV, VPRS 5707/P0, 1871–1872.
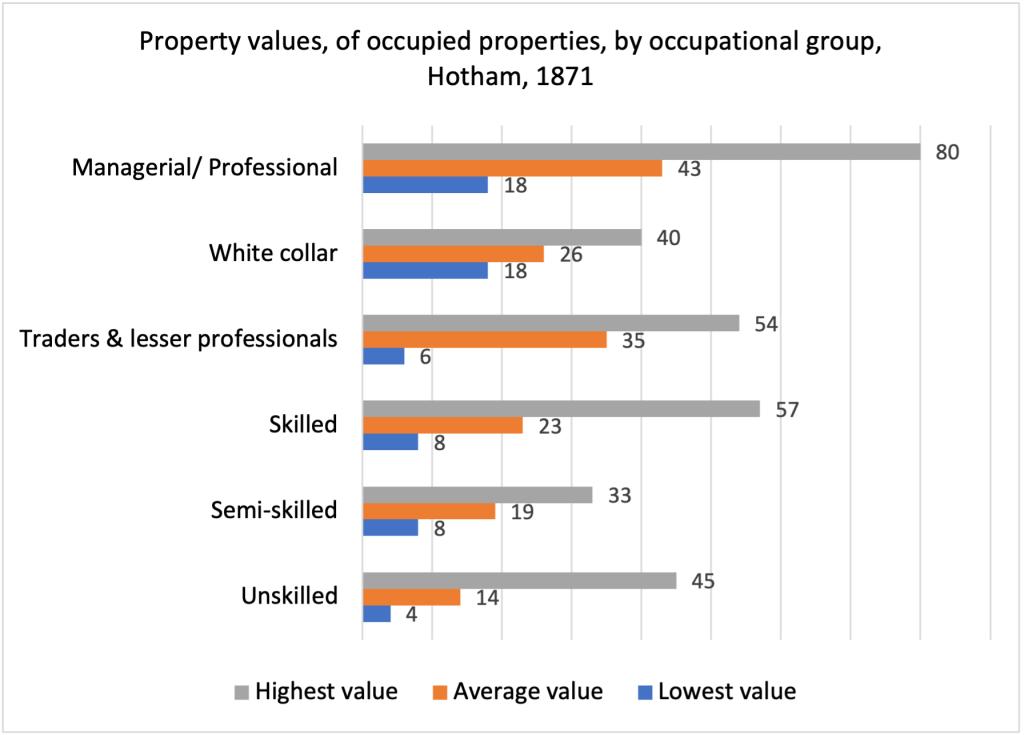
Figure 6: Property values by occupational group, Hotham, 1871. There is a clear pattern linking occupational groups to the average value of homes, yet a considerable variance between the highest and lowest value of homes occupied by each group. Calculated from a 1 in 10 sample of PROV, VPRS 5707/P0, 1871–1872.
In the long-term context of the development of North Melbourne, drawn from comparing rate book data over decennial intervals from 1861 to 1901, the 1860s is revealed as the period in which equity of home ownership was at its highest level. This is partially explained by there being more skilled workers living in North Melbourne in 1871 than in any other decade in the nineteenth century (Figure 7). Over 40 per cent of skilled workers, traders and lesser professionals, white-collar workers and managerial/professionals owned their own homes (Figure 5). As a whole, however, 65 per cent of residents were renters in 1871.[28]
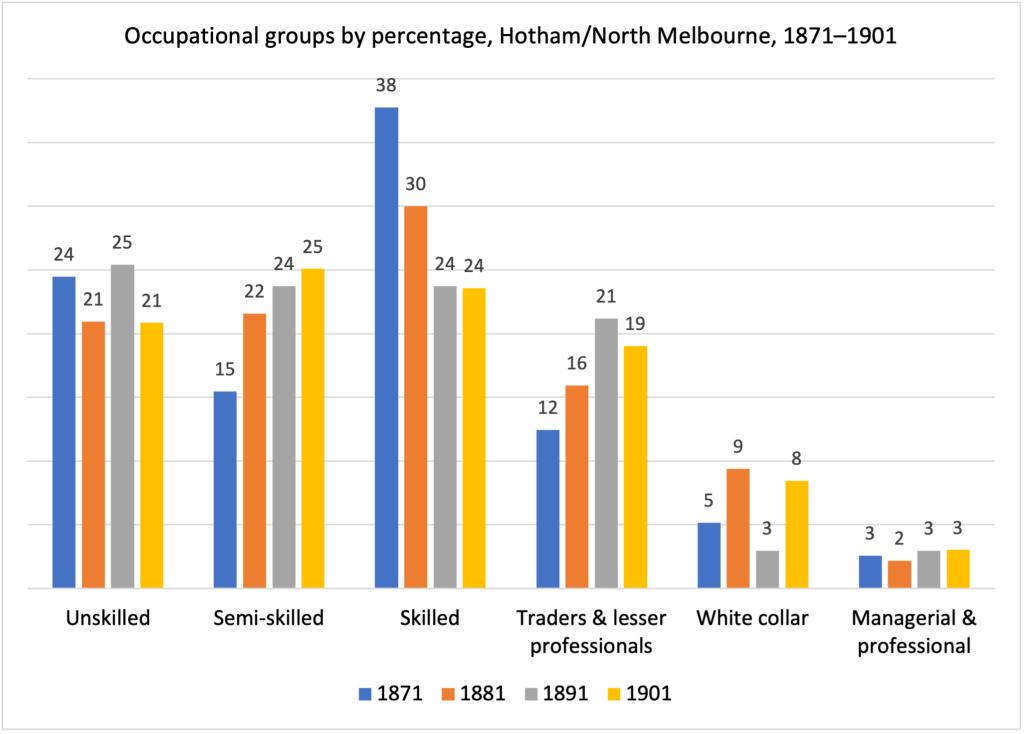
Figure 7: In this graph we can see the occupational profile of Hotham/North Melbourne solidify over the late nineteenth century into the working-class profile it became well-known for by the early twentieth century. Calculated from a 1 in 10 sample of PROV, VPRS 5707/P0, 1871–1872, 1881–1882, 1891–1892, and 1901–1902.
The gaps in our understanding of Melbourne’s property market are shown by comparing this study of North Melbourne with other areas of Melbourne where quantitative rate book data have been collected. Drawing on the academic studies mentioned earlier, in 1891, 48 per cent of residents rented in Williamstown, 61 per cent in Brunswick and 66 per cent in Collingwood. In 1893, 50 per cent of residents rented in Footscray.[29] In North Melbourne 74 per cent of residents were renters in 1891.[30] It is remarkable how high the percentage was, even compared to Collingwood, which was also an inner suburb of (mainly) working-class residents. Dingle and Merrett suggest the average tenancy rate in Melbourne in 1891 was 55.8 per cent, which then increased further in the final decade of the nineteenth century.[31] Tenancy levels in North Melbourne were considerably higher than this level even in the 1880s.
Conclusion
Any deep dive into an archive is time-consuming and this is certainly true of long-term big data collection from rate books. Yet the effort is rewarding. The ‘triangle’ and the ‘hill’ case study exemplifies how urbanisation could occur so differently in two areas, side by side in one municipal area, as economic realities led to a diversity of lived experiences. The ability to track trends over an extended period reveals the economic realities of residents, expressed in housing patterns, as they developed. The quantitative data from the rate books concerning occupations, tenants and property owners reveal the outcomes of capitalist forces shaping North Melbourne. North Melbourne’s history of housing reveals the development of an underclass of renters, something we should be particularly concerned with given the contemporary rental crisis in Australia today. Comparing these new data with the sparse amount of data available from previous studies suggests the normative trend we thought we knew about tenancy rates in Melbourne can be challenged by collecting and analysing local data. This method can be applied not only to other areas of Melbourne but also across Victoria, in other Australian cities and outside Australia.
Endnotes
[1] Weston Bate, A history of Brighton, Melbourne University Press, Parkville, 1963.
[2] Graeme Davison, ‘The rise and fall of “Marvellous Melbourne”, 1880–95’, PhD thesis, University of Melbourne, 1969, ch. 8; Graeme Davison, The rise and fall of marvellous Melbourne, Melbourne University Press, Carlton, 1978.
[3] John Lack, A history of Footscray, Hargreen, North Melbourne, 1991.
[4] Terry Grigg, ‘Landlord and tenant relations, Melbourne 1860–1980’, PhD thesis, La Trobe University, 1994.
[5] Anthony Dingle & David Merrett, ‘Home owners and tenants in Melbourne 1891–1901’, Australian Economic History Review, vol. 12, no. 1, 1972, pp. 21–35; Anthony Dingle & David Merrett, ‘Landlords in suburban Melbourne, 1891–1911’, Australian Economic History Review, vol. 17, no. 1, 1977, pp. 1–24.
[6] Philippa M Smith & Lionel Frost, ‘Home ownership in Adelaide, 1881–1911’, Australian Economic History Review, vol. XXXV, no. 1, March 1995, pp. 40–56; RV Jackson, ‘Owner-occupation of houses in Sydney, 1871 to 1891’, Australian Economic History Review, vol. 10, no. 2, Jan 1970, pp. 138–154; Heather Holst, Making a home: a history of Castlemaine, Australian Scholarly Publishing, North Melbourne, 2014.
[7] Andrew May, ‘Weston Bate (1924–2017)’, Australian Historical Studies, vol. 49, no. 4, 2018, pp. 546–9; Graeme Davison, ‘Fifty years of Victorian local history’, Victorian Historical Journal, vol. 84, no.1, 2013, pp. 120–138.
[8] James Lesh, ‘“Differences within a range of similarity”: mapping Australian urban history’, Urban History, 2023, pp. 1–13.
[9] Lovell Chen, North Melbourne heritage review, City of Melbourne, July 2022.
[10] Notable theses include Joan Campbell, ‘The settlement of Melbourne 1851–1893: selected aspects of urban growth’, masters thesis, University of Melbourne, 1970; Lesley Ann Fricker, ‘Aspects of Melbourne’s nineteenth century urbanisation process’, PhD thesis, University of Melbourne, 1978.
[11] PROV, Melbourne (Town 1842–1847; City 1847-ct) (VA511), VPRS 5707/P0, Rate Books (Hotham/North Melbourne), 1855–1858 and North Melbourne (Borough of Hotham 1859-1874; Town of Hotham 1874-1887; Town of North Melbourne 1887-1905) (VA3153 ), VPRS 5707/P0, Rate Books (Hotham/North Melbourne), 1859–1905.
[12] The following sources were used to create Figure 2: Jika Jika and Melbourne no. 18 [cartographic material], 1851, Vale collection, State Library Victoria (SLV); Thomas Ham & Co. & Victoria, Department of Crown Lands Survey, Map of the suburban lands of the City of Melbourne [cartographic material], 1852, Ham Bros., Litho, Melbourne, SLV; J Brown, J Kearney & D Tulloch, Melbourne and its suburbs [cartographic material], 1855, Andrew Clarke, Surveyor General, Melbourne, SLV; Victoria, Public Lands Office, Town allotments, North Melbourne and Parkside [cartographic material], 14 October 1858, Public Lands Office, Melbourne, SLV.
[13] Sands & McDougall’s Directory, various between 1861 and 1900, SLV.
[14] PROV, VPRS 5707/P0, Rate Books (Hotham/North Melbourne), 1859–1905.
[15] The north side of Chapman Street (Crown land section 82, allotments 21–39) was sold in January (allotments 19–20) and September (allotments 21–31) 1864. The south side (Crown land section 82, allotments 1–30) was sold in September 1865: PROV, VPRS 11862/P/0001, Reports of Land Sales by Public Auction.
[16] The 1871–72 rate book lists Gilchrest as ‘teacher’ and it is reasonable to assume that this is the same Gilchrest who became head of No. 459, see Leader, 16 June 1883, p. 40.
[17] On Barwise, see Heather McKay, Men of Hotham: municipal government in North Melbourne, 1859–1905, Hotham History Project, North Melbourne, 2006, pp. 16–17.
[18] The following sources were used to create Figure 4: Melbourne and Metropolitan Board of Works, Melbourne and Metropolitan Board of Works detail plan, 754 & 755, Town of North Melbourne [map], 1897, ID 1162166, filename bw0432 and 753 [map], 1897, ID 1162165, filename bw0431, SLV; PROV, VPRS 5707/P0, 1871–1872.
[19] For example, ‘Hotham Hill’, Argus, 27 August 1868, p. 8; Argus, 29 May 1869, p. 1.
[20] Winsome Roberts, Molesworth Street: a North Melbourne neighbourhood, 1840–1905, Hotham History Project, North Melbourne, 2002, pp. 16, 20.
[21] Guy Murphy, At home on Hotham Hill: portrait of a nineteenth century entrepreneur, Hotham History Project, North Melbourne, 2004.
[22] ‘Saturday, February 6’, Argus, 3 February 1869, p. 2.
[23] Robert West, ‘Friday Sep the 1st 1876’, journal entry, Records of Melbourne City Mission, 1989.0090, volume/box 13, University of Melbourne Archives; Leslie R. Cassidy, A life in Happy Valley. Doris May’s eight decades of memories, Leslie R. Cassidy, North Melbourne, 1991.
[24] PROV, VPRS 5707/P0, 1871–1872.
[25] PROV, VPRS 5707/P0, 1871–1872; Sands & McDougall’s Directory, 1871.
[26] PROV, VPRS 5707/P0, 1871–1872; Herald, 14 December 1871, p. 3.
[27] This link between occupational status and annual rate value of residences was also noted by Davison, The rise and fall of marvellous Melbourne, p. 174.
[28] Calculated from a 1 in 10 sample of PROV, VPRS 5707/P0, 1871–1872.
[29] Hotham/North Melbourne figures from a 1 in 10 sample of PROV, VPRS 5707/P0; data for other suburbs from Davison, The rise and fall of marvellous Melbourne, p. 239 (collated from studies done by Davison, Dingle & Merrett, and Lack).
[30] Calculated from a 1 in 10 sample of PROV, VPRS 5707/P0, 1891–1892.
[31] Dingle & Merrett, ‘Home owners and tenants in Melbourne 1891–1901’, p. 26.
Material in the Public Record Office Victoria archival collection contains words and descriptions that reflect attitudes and government policies at different times which may be insensitive and upsetting
Aboriginal and Torres Strait Islander Peoples should be aware the collection and website may contain images, voices and names of deceased persons.
PROV provides advice to researchers wishing to access, publish or re-use records about Aboriginal Peoples